What is a coding diagram?
Coding diagrams are code-generated visualizations of technical information or knowledge. One of the first popular technologies to enable code-generated visualizations is the Unified Modeling Language (UML). It was developed in the mid-1990s and eventually evolved to become an ISO standard. Today, we have many more options for coding diagrams than UML, many of which cater to the tastes and requirements of modern software developers.
The UML standard was purpose-built for visualizing information and knowledge primarily for software architecture. UML caters to two high-level categories of diagrams: structural and behavioral. Today’s tools are even more expressive and are fairly unbounded, allowing developers to go well beyond software architecture documentation purposes.
The process of creating visualizations from code has many names and varying terminology:
- Code visualization
- Code (or coding) diagrams
- Diagrams as code
- Diagramming notation
- Text to diagram
This is a part of a series about code documentation.
Why are coding diagrams important?
Coding diagrams are important tools for a few reasons.
Coding diagrams are easier to understand
People learn faster with visual aids, especially when understanding complex information. Reading requires more intellectual energy than looking at and interpreting a picture.
Coding diagrams can be managed as part of the software development life cycle
Diagrams as graphics require visual inspection, but diagrams as code do not. Code-generated diagrams can be managed as part of the SDLC. They can be tracked, tested, commented on, versioned, and automated. For teams practicing Continuous Documentation, diagram code can be maintained to ensure correctness, even as the code changes—just like any other code.
Coding diagrams are lightweight, portable, and easily manipulated
- Lightweight – a single flowchart graphic can easily weigh several megabytes, whereas a coding diagram is orders of magnitude smaller.
- Portable – they don’t require storage in an asset library and can be rendered in real-time.
- Easily manipulated – they are pure code. Because they can be maintained with a stylesheet, there’s no need to open Photoshop or another image editing software. Ever.
Tips from the expert

How to use code diagrams
There are many types of coding diagrams—more than we can list, really. Here are just a few of the many dozens of coding diagrams that complement and improve technical documentation.
- Mind maps
- Architecture diagrams
- Use case diagrams
- User journeys
- Object and class diagrams
- State diagrams
Top diagram tools for code
Code diagrams are easy to use and create, but they require tools to generate and render. There’s no standardized language for coding diagrams. Some tools use their own proprietary marketup, some use JSON, others use Markdown (or “Markdown-inspired” markup), and other tools are modules that extend programming languages, like Python or Ruby.
There are two leading diagramming tools for code diagrams. Each has its own strengths and offers different implementation methods for code diagrams.
Mermaid

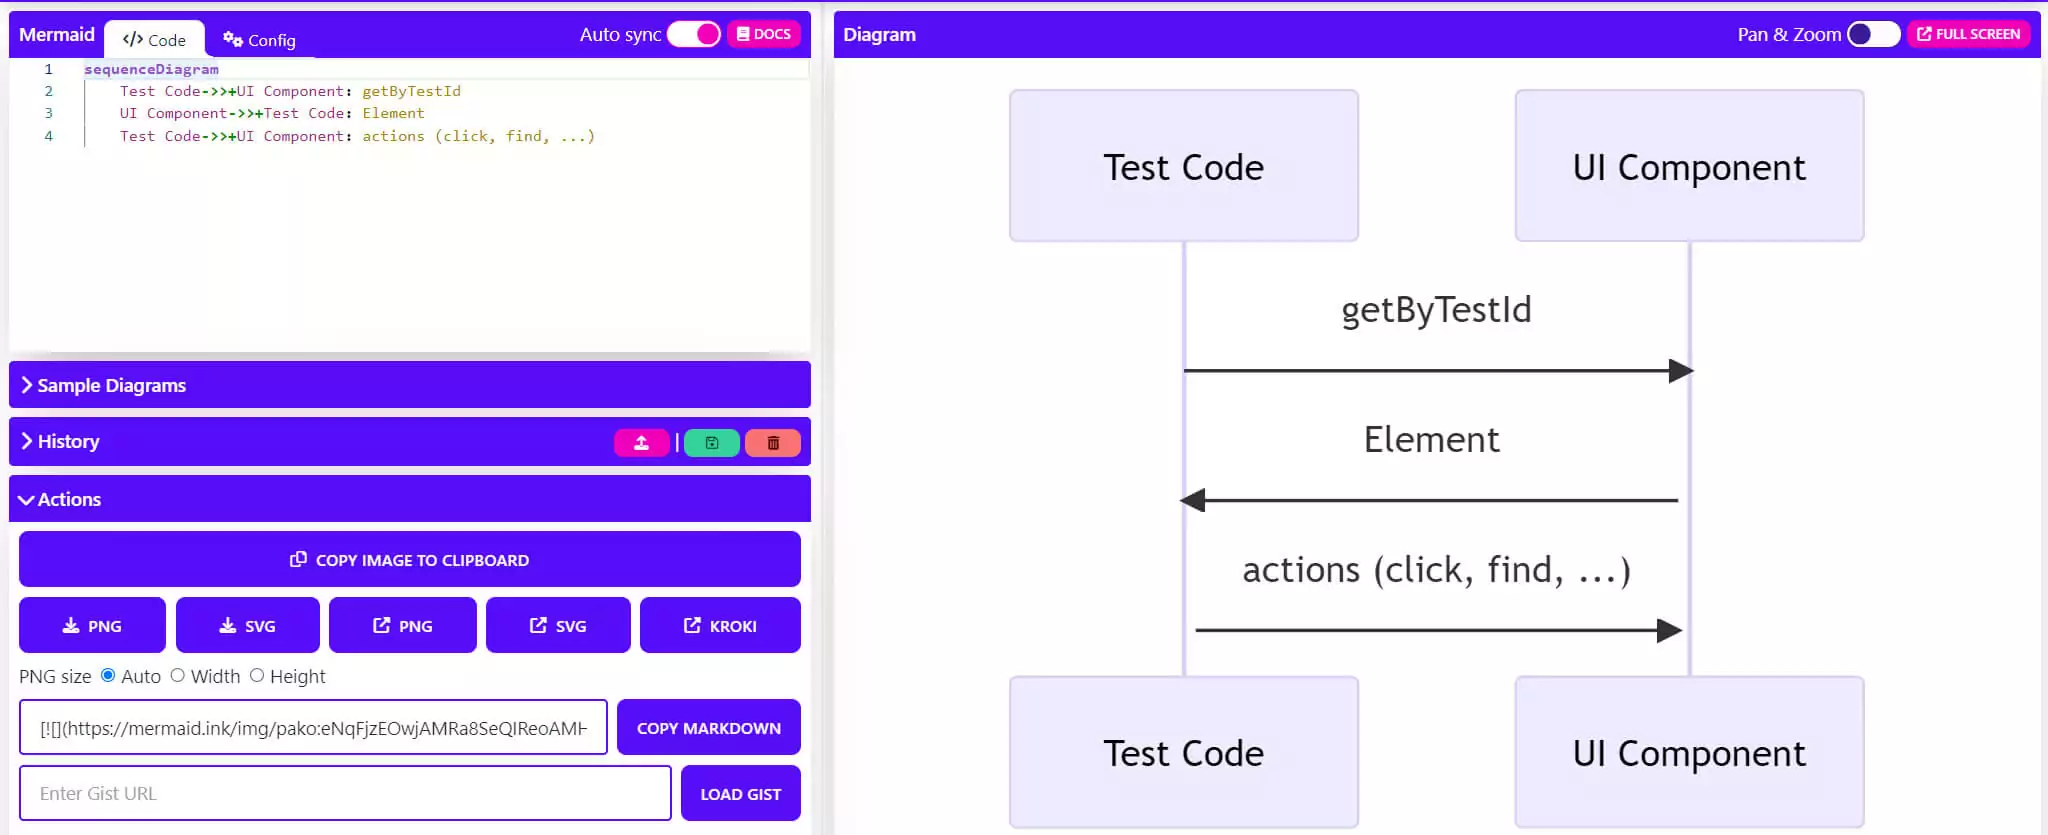
Mermaid is a “JavaScript-based diagramming and charting tool that uses Markdown-inspired text definitions and a renderer to create and modify complex diagrams.” More importantly, they have a mission to advance technical documentation to match the speed of software development. In 2019, it won the “Most Exciting Use of Technology” award from OS Awards.

One of the best features of Mermaid is the live editor, which allows you to modify a diagram’s code in the left pane and see the results in real-time on the right pane. The live editor includes several easily-modifiable sample diagrams, including:
- Sequence
- Flow
- Class
- State
- Gantt
- User journey
- Mindmap
Diagrams can be exported to PNG or SVG with the click of a button, making it easy to embed and style diagrams natively into existing documentation. The Mermaid team has even published a book about the tool and how to make the most of it.
You can now add charts and diagrams to your documentation in Swimm with Mermaid’s Syntax in the editor. More about that at the end of this post.
PlantUML

PlantUML is an open source component that generates UML and non-UML diagrams from text descriptions. It is widely supported by sponsors and a large user base. Whereas Mermaid uses “Markdown-inspired text definitions,” PlantUML has its own domain-specific language (DSL) that has broad-reaching interpretation, allowing you to use other DSLs like LaTeX and AsciiMath. It also has built-in accessibility features for blind users, integrations with popular IDEs, documentation hubs, and word processors.

Many types of diagrams can be generated with PlantUML:
- UML diagramsSequence
Use case
Class
Object
Activity
Component
Deployment
State - Non-UML diagramsJSON and YAML
Network
Wireframe UIs
Specification and Description Language (SDL)
Gantt
Mindmap
Work breakdown structure
Both PlantUML and Mermaid are leading tools for code-generated diagrams.
Top diagram tools that do not support code-generated diagrams
There are a bunch of other leading diagramming tools that are good tools for easy diagram creation and editing.
Draw.io (aka Diagrams.net)

Draw.io is a powerful tool that allows highly sophisticated graphics, including architectural floorplans, infographics, and website wireframes. It uses a drag-and-drop user interface for its web-based WYSIWYG editor. It is a cloud-hosted app that’s free and easy to use. You don’t need to sign up for an account; you can use it anonymously.

The New File dialog offers dozens of useful templates and diagram types that are quickly and easily editable. Diagrams can be exported as PNG, JPG, SVG, PDF, HTML, XML, and other formats. As a free, open source application built on HTML and Javascript, Draw.io is available on many platforms, including a downloadable application.
Lucidchart

Like Draw.io, Lucidchart is a closed-source commercial product with a drag and drop, WYSIWYG web-based interface. It has an interface similar to Draw.io but offers live collaboration capabilities within the same document. Because it is a commercial product, it features many integrations and enterprise support. Free, open source software has many benefits but usually does not have commercial support options, which is mission-critical for many enterprises.

Lucidchart is cloud-based, which means they store all diagrams within its infrastructure. It can import files in many formats, including proprietary apps like OmniGraffle and Visio. It has other unique features, like linking data directly to objects, leaving comments on objects, and native mobile apps.
You can use Lucidchart for free or access the various paid tiers.
Visio

Microsoft Visio is part of the Microsoft Office commercial product suite. It was initially released as a free app in 1992 on a floppy disk. Microsoft acquired Visio in 2000 and has been maintaining it ever since. It has a very mature feature set and is easily the world’s most popular diagramming application available today.

Any type of technical diagram can be generated within Visio. It has deep integrations with other apps within the Microsoft Office ecosystem, including Excel and PowerBI, which are useful for data linking and charts. Like Lucidchart, it offers sophisticated collaboration features, native mobile applications, industry-leading accessibility features, and enterprise-level support. It can be accessed within a web browser or dedicated applications for the most popular operating systems.
Visio supports a wide variety of file formats, most of which are proprietary and not web friendly. Because it started as a proprietary desktop application, it does not have as many import and export options as web-native products like Lucidchart. But, because it’s the biggest player in the diagramming market, Microsoft is not prioritizing open formats and features like other tools in this list.
Gliffy

Gliffy is an enterprise-grade, closed source, web-based diagramming application. It matches many competing tools’ features, including collaboration, easy sharing, and support for multiple formats. However, its top selling point is its native integration with Atlassian’s Confluence and JIRA tools.

Like Lucidchart, Visio, and Draw.io, it uses a drag and drop WYSIWYG web-based interface. Because so many companies use Atlassian software, Gliffy is going all-in on their Atlassian integration. They offer two app flavors: Gliffy for Confluence & Jira, and Gliffy Online. The latter is not strictly bound to Atlassian products and has fewer features than Gliffy for Confluence & Jira.
Gliffy’s products are capable of handling multiple file formats, like Microsoft Visio, JPG, SVG, and PNG.
Use Swimm to keep your code diagrams always up to date
Mermaid is our favorite of all the coding diagram tools, and we’ve even integrated it directly into Swimm.
Here’s why we like it:
- It’s really easy to use.
- The code is human-readable.
- The Mermaid live web editor shows real-time updates between code and diagrams.
Swimm allows you to use the slash command /mermaid or paste Mermaid syntax directly into your docs.
For example, if you are tracking a global variable in your Swimm docs and that variable is linked to your Mermaid diagram, Swimm can notify you that the diagram needs to be updated. Same for a function (whose name may change, or usage), or a path. And because all Swimm docs are stored directly in the same repository as the code, docs are code-coupled to allow for Continuous Documentation.
By natively integrating Swimm and Mermaid, we enable developers to update their graphical elements in real-time.
If you want to see Continuous Documentation in action and get started with coding diagrams, get started by signing up for free today