What Is Mermaid.js?
Mermaid.js is a powerful, open-source tool designed to create diagrams and flowcharts using text and script processing. It was developed to address the need for a simple, flexible way to generate diagrams dynamically based on predefined information. With Mermaid.js, developers can easily create complex diagrams in their documentation, making it easier for readers to understand their work.
The beauty of Mermaid.js lies in its simplicity. You don’t need to be a graphic designer or have advanced programming skills to use it effectively. All you need is a basic understanding of JavaScript and a willingness to learn. The tool uses a simple markdown-inspired syntax that is easy to learn and use. However, despite its simplicity, Mermaid.js is incredibly flexible and powerful, offering a wide range of diagram types and customization options.
Examples can be extremely useful to get started with Mermaid.js. In this guide, we’ll provide a range of examples, from basic to advanced, to help you discover this powerful tool and make your web development projects more efficient and visually engaging.
Learn more in our detailed guide to mermaid js examples.
This is part of a series of articles about mermaid js.
1. Mermaid.js flowchart example
One of the most common uses of Mermaid.js is in generating flowcharts. These are visual representations of processes, showing the steps in a process and their sequence. Mermaid.js makes it easy to create interactive flowcharts that can enhance your project’s documentation.
Let’s look at a simple example. Suppose we want to visualize a basic decision-making process. In Mermaid.js, this could be represented as follows:
graph TD;

    A-->B;

    A-->C;

    B-->D;

    C-->D;
The code generates the following diagram:
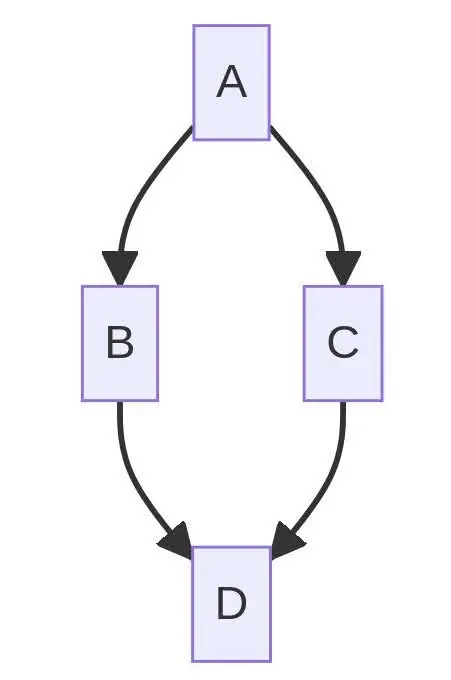
In this example, ‘A’ represents the starting point of the process. The arrows (–>), indicate the flow of the process. ‘B’ and ‘C’ are decision points, and ‘D’ is the end of the process. This simple syntax allows us to create a visual representation of a complex process, making it easier for others to understand.
Mermaid.js also supports more complex flowchart elements, such as loops and conditionals. This means you can represent even the most complex processes in a simple, visual way.
2. Mermaid.js sequence diagram example
Another powerful feature of Mermaid.js is its support for sequence diagrams. These diagrams are used to illustrate the interactions between different components in a system. They show how different components interact with each other over time.
Here is an example of a simple sequence diagram in Mermaid.js:
sequenceDiagram

    participant Sarah

    participant John

    Sarah->>John: Hello John, how are you?

    John-->>Sarah: Not too bad, thanks!
The code generates the following diagram:
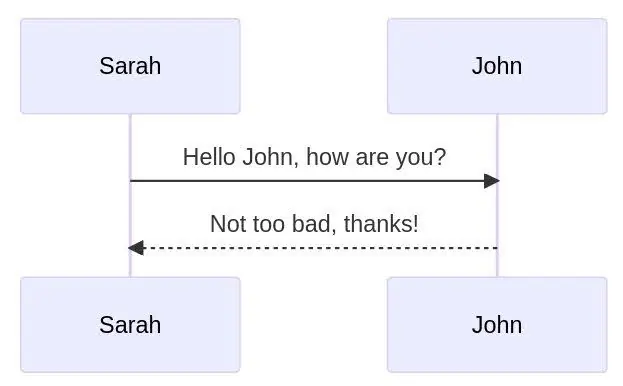
In this example, ‘Sarah’ and ‘John’ are participants in a conversation. The arrows (->>) represent messages sent from one participant to another. This simple syntax allows us to create a visual representation of a conversation between two participants, making it easier for others to understand.
Mermaid.js also supports more complex sequence diagram elements, such as loops, conditionals, and parallel interactions.
3. Mermaid.js class diagrams examples
Mermaid.js also offers support for class diagrams. These diagrams are a staple in object-oriented programming, used to represent the structure of a system by showing the system’s classes, their attributes, and the relationships between them.
Here’s an example of a simple class diagram in Mermaid.js:
classDiagram

    BookStore <|-- Book

    BookStore <|-- Author

    BookStore : +String location

    BookStore : +int totalBooks

    BookStore: +findBook()

    BookStore: +getAuthor()

    class Book{

        +String title

        +int publicationYear

        +read()

    }

    class Author{

        -String name

        -write()

    }
The code generates the following diagram:
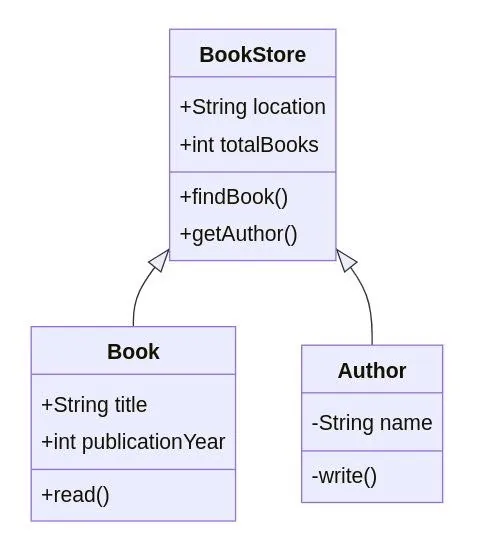
In this example, ‘BookStore’ is a superclass of ‘Book’ and ‘Author’. The arrows (<|–) represent inheritance. The ‘+’ and ‘-‘ symbols represent public and private attributes, respectively. This simple syntax allows us to create a visual representation of a class structure, making it easier for others to understand.
Mermaid.js supports many more class diagram elements, such as interfaces, associations, and dependencies.
4. Mermaid.js entity relationship diagrams examples
Entity Relationship Diagrams (ERDs) are another powerful feature of Mermaid.js. These diagrams are used to represent the relationships between different entities in a database. They show how different entities are related to each other, making them invaluable for understanding complex databases.
Here is an example of a simple ERD in Mermaid.js:
erDiagram

    CUSTOMER ||--o{ ORDER : places

    ORDER ||--|{ LINE-ITEM : contains

    PRODUCT ||--o{ LINE-ITEM : is listed in
The code generates the following diagram:
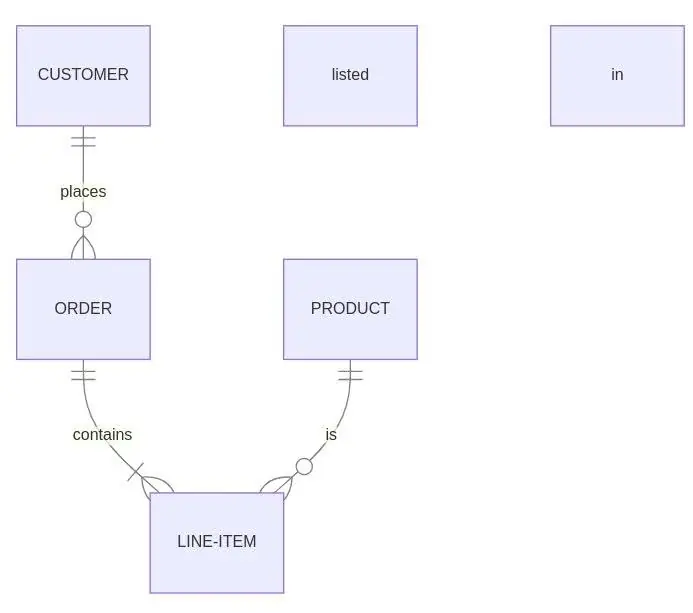
In this example, ‘CUSTOMER’, ‘ORDER’, ‘LINE-ITEM’, and ‘PRODUCT’ are entities in a database. The symbols (||–, o{, |{) represent different types of relationships. This simple syntax allows us to create a visual representation of a database structure, making it easier for others to understand.
Mermaid.js also supports more complex ERD elements, such as weak entities, ternary relationships, and attributes.
5. Mermaid.js mind map examples
Mind maps are diagrams used to visually organize information, often used in brainstorming sessions to capture and organize ideas. Here’s an example of a simple mind map in Mermaid.js:
graph LR

Mindmap --> Idea1

Mindmap --> Idea2

Idea1 --> SubIdea1

Idea2 --> SubIdea2

style Mindmap fill:#F9D6A1

style Idea1 fill:#A1D6F9

style Idea2 fill:#A1D6F9

style SubIdea1 fill:#A1D6F9

style SubIdea2 fill:#A1D6F9
Note that the style statements allow you to specify a color or other attributes for elements in the diagram.
This code generates the following diagram:
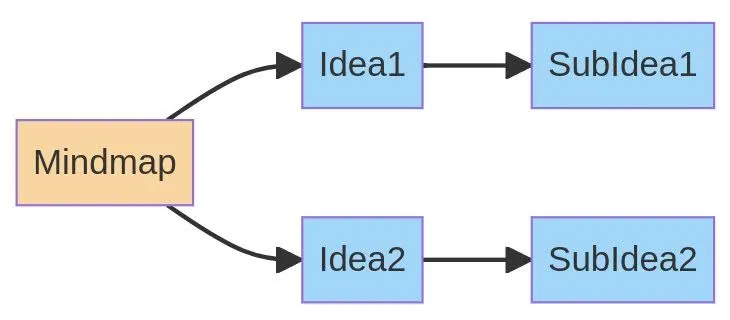
In this example, ‘MindMap’ is the central idea, and ‘Idea1’ and ‘Idea2’ are sub-ideas. The arrows (–>), represent connections between ideas. This simple syntax allows us to create a visual representation of a mind map, making it easier for others to understand.
Mermaid.js also supports more complex mind map elements, such as different shapes for nodes and customizable link styles.
Related content: Read our guide to Mermaid. js alternative
Mermaid.js with Swimm
Without a doubt, Mermaid.js is an excellent tool for visualizing code, the output of which is not just developer-friendly, but truly easy to understand. That said, at Swimm, in homage to the old saying, if a visualization is made, but no one can find it, is it really there?
Hyperbole aside, Mermaid.js’s diagrams are often integral and necessary parts of code documentation. When new team members need to get up to speed, visualizations can be far more efficient in terms of education tools than simple text descriptions, particularly in the case of more visual learners. And yet, we repeat our previous question.
With Swimm, let your docs come to you – not the other way around – the moment they’re required. The act of documentation might be a hassle, but Swimm docs can live in the IDE & CI/CD, wherever they’re needed most – saving you time and money, particularly when it comes to arduous onboarding processes.